Extended functionality of MotorData OBD
The MotorData OBD application allows you to read 30-40 current parameters of the engine management system when connected to a car using the OBDII / EOBD diagnostic protocol.

The use of plugins significantly expands the capabilities of the device and makes the MotorData OBD application unique on the market. Diagnostic plugins by brand allow you to:
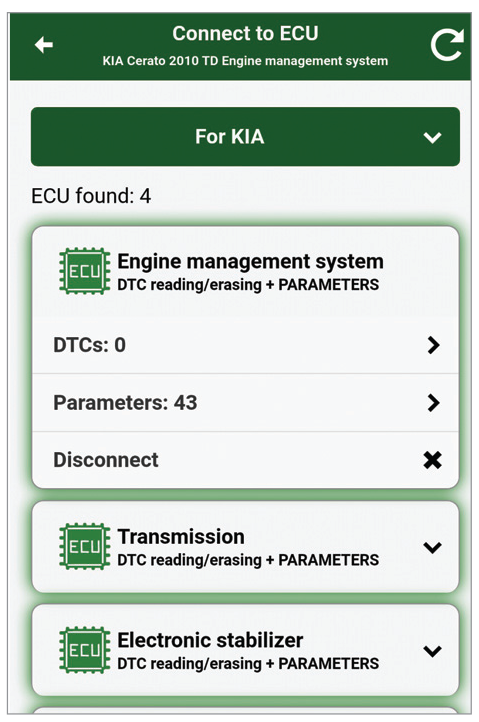
– significantly increase the number of diagnosed systems, for example, transmission, ABS, SRS, ESP (electronic stability program), TCL (traction control), control systems, All-Wheel drive (AWD/4WD), chassis & car body electrical equipment, etc.
– significantly increase the number of parameters which can be read / current data (up to 200) for various systems.
The configuration plugin “Dashboard, logs, parameters” allows to:
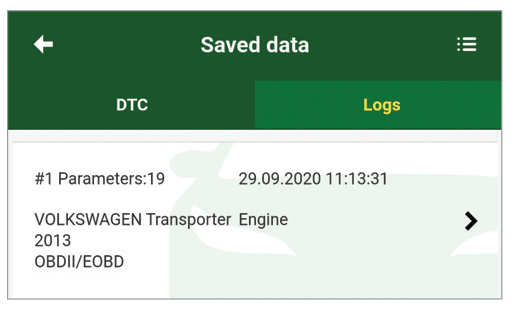
– play logs of recorded data.
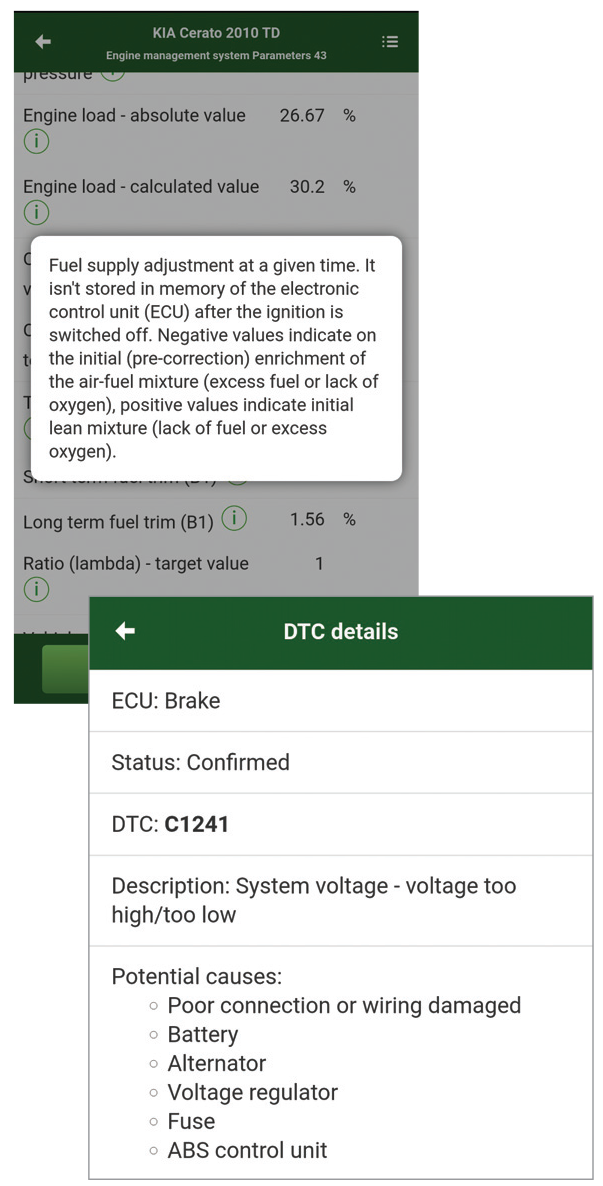
– get hints and explanations for important parameters.
– to decipher the possible causes of faults in popular codes.
– decode more diagnostic codes (extended OBDII list).
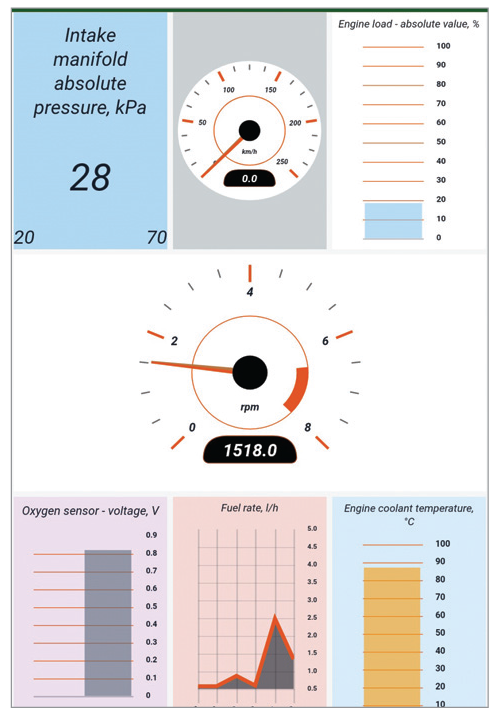
– adjust all parameters in the “Instrument panel” section.
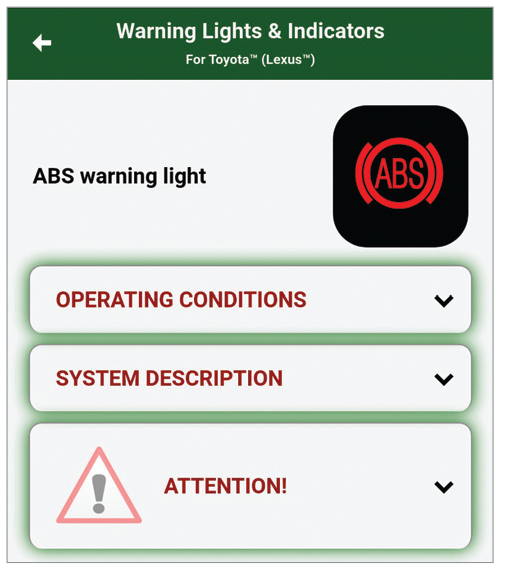
– meaning of indicators,
– description of systems and principles of operation,
– recommendations for the driver, what is needed when this or that indicator lights up.
Ways to connect to a car
- The initial connection to the car is made through the “Settings” menu, the “Connection” tab (see the “Connection instructions” section).
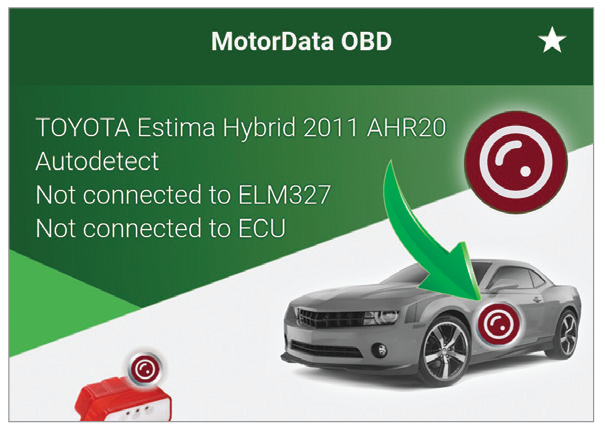
- In the future, after setting the connection parameters, you can connect to the car by clicking on the car image on the main screen of the application.
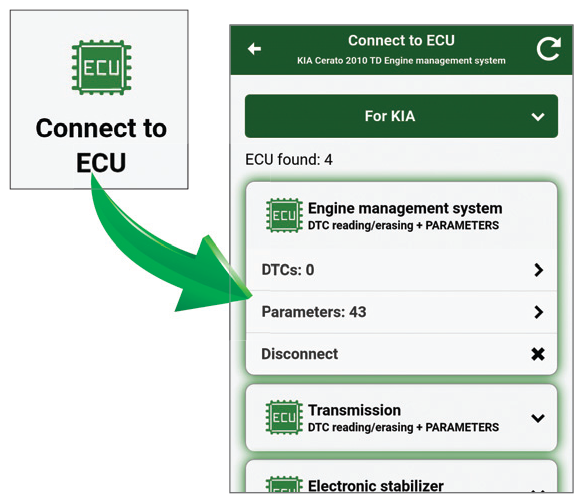
- If, after the initial connection, several systems were detected on the car, then in the future you can immediately connect to the desired system. To do this, select the system in the “Connect to ECU” menu and click “Connect”.
- Also, the application has the ability to automatically connect to the car immediately after starting the application. To enable this function in the “Settings” menu, in the “Connection” tab, you must check the box next to the “Automatically connect to the ELM adapter when the application starts” item.

Application settings
Setting the list of parameters
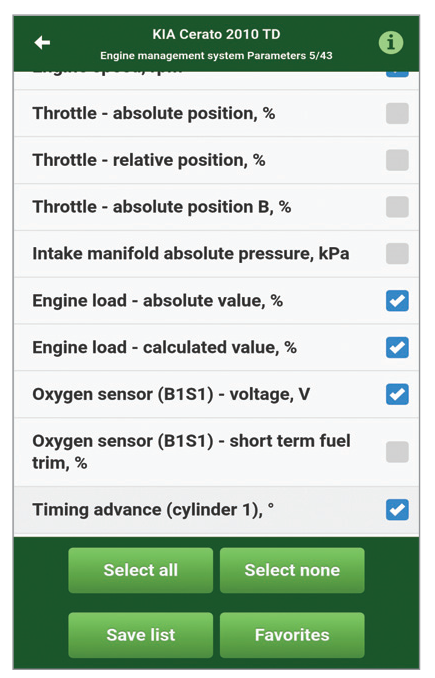
The application allows you to read up to 200 different parameters on some cars, but the parameters are polled sequentially, so the data can be updated slowly, making it difficult to analyze. To speed up the data display speed and graph display quality, you can customize the parameter list. To do this, in the “Current data” menu, please, click “Configure the list of parameters”, mark only the parameters necessary to read and click “Save list”. You can create several sets of parameters and quickly switch between them within one car profile, loading them from the favorites (menu “Current data” – “Configure the list of parameters” – “Favorites”).
Setup of Instrument panel

Saving and viewing data
b) In order to view the stored codes, please, enter the “Save codes and logs” menu.
c) Please. go to the “Codes” tab.
e) Select the required data and view it.

Recording and playback of Logs
a) To record, please, enter the “Current data” – “Table” menu and click “Log”.
b) To stop reading and writing the current data, please, press “Stop”.
c) In order to replay the data, please, enter the “Save codes and logs” menu.
d) Please, go to the “Logs” tab.
e) Please, select the required log and reproduce it.